I’ve learned to use two programming languages with GIS. Basic use of ArcPy was expanded by studying Python using Google Colab Notebooks with occasional use of Github. I used Python with the STATS 19 database to study the incidence of road traffic collisions and identify temporal autocorrelation consistent with national findings reported by the department for transport.
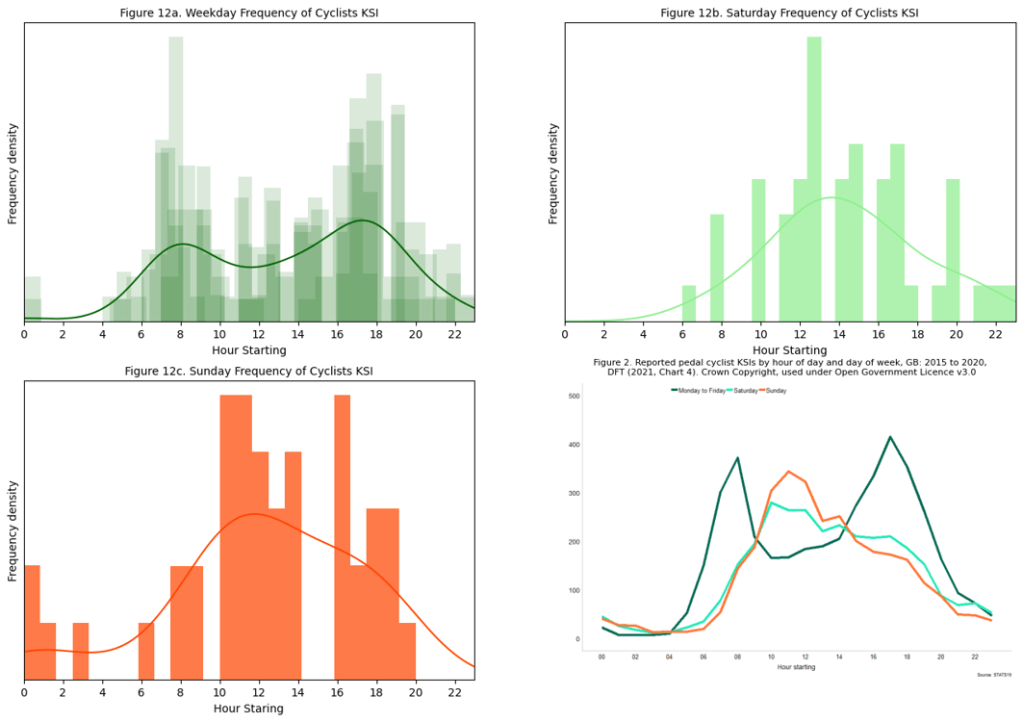
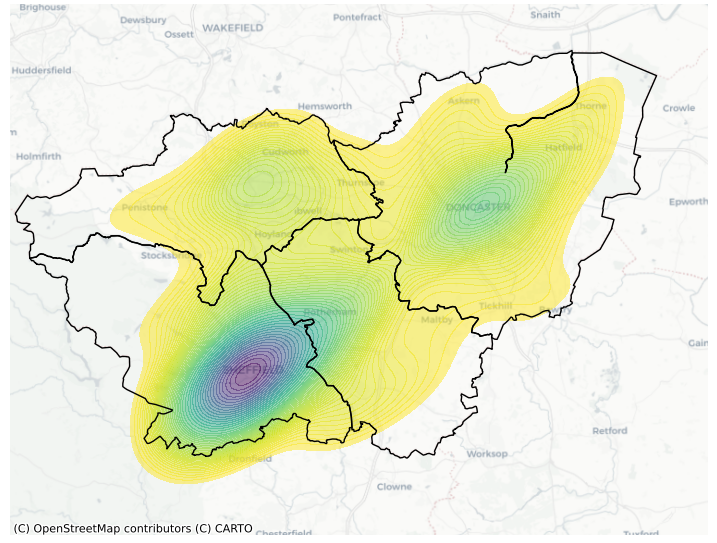
The database was wrangled, measured and filtered to extract cyclists killed and seriously injured in South Yorkshire Police Force Area. This kernel density plot shows the high density of serious and fatal accidents in Sheffield.
“
easy to follow and well documented
”
R-Studio
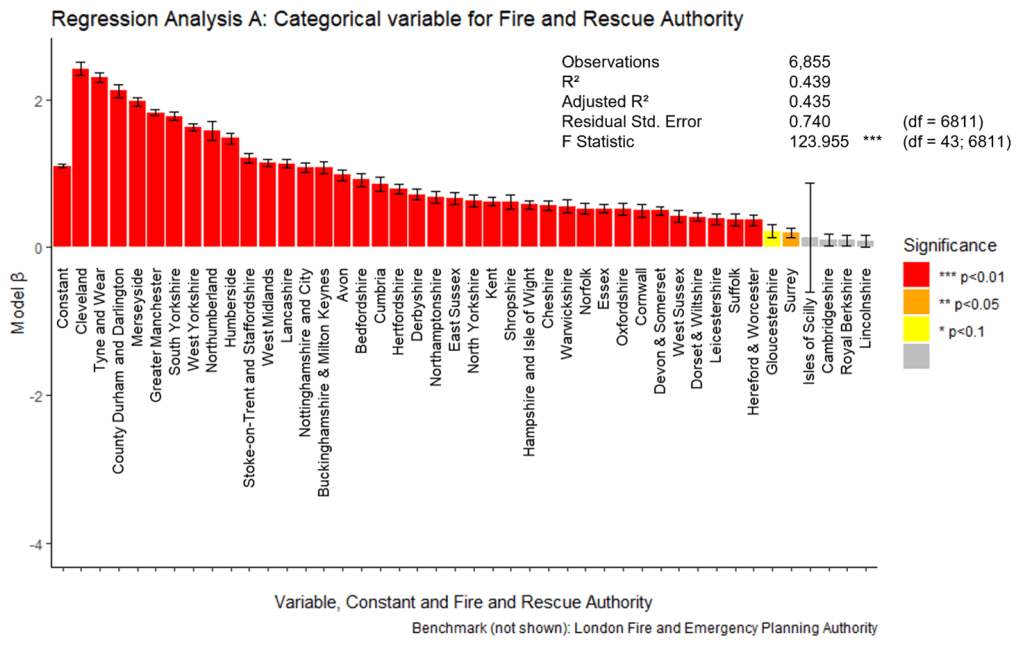
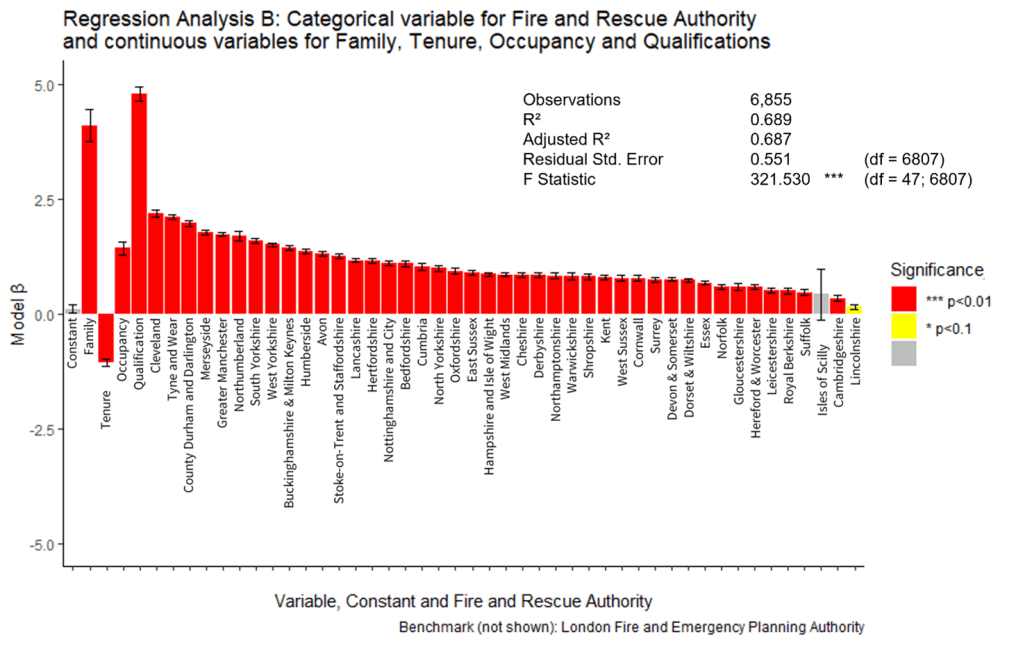
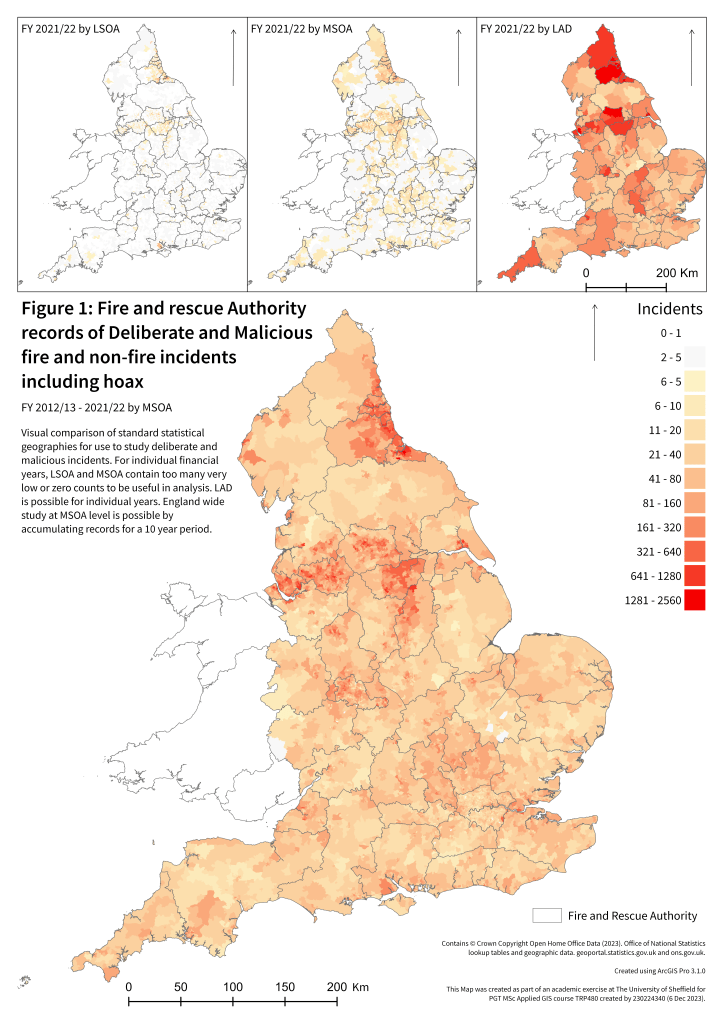
In this second example R-Studio was used to conduct a linear regression analysis of incidents reported to the Fire and Rescue Service over 10 years. This long timeframe was necessary to generate statistically significant insights. The overview map was created using ArcGIS Pro.
“
very strong report with exceptional detail and consideration …
The visuals are intuitive, well designed and presented
”
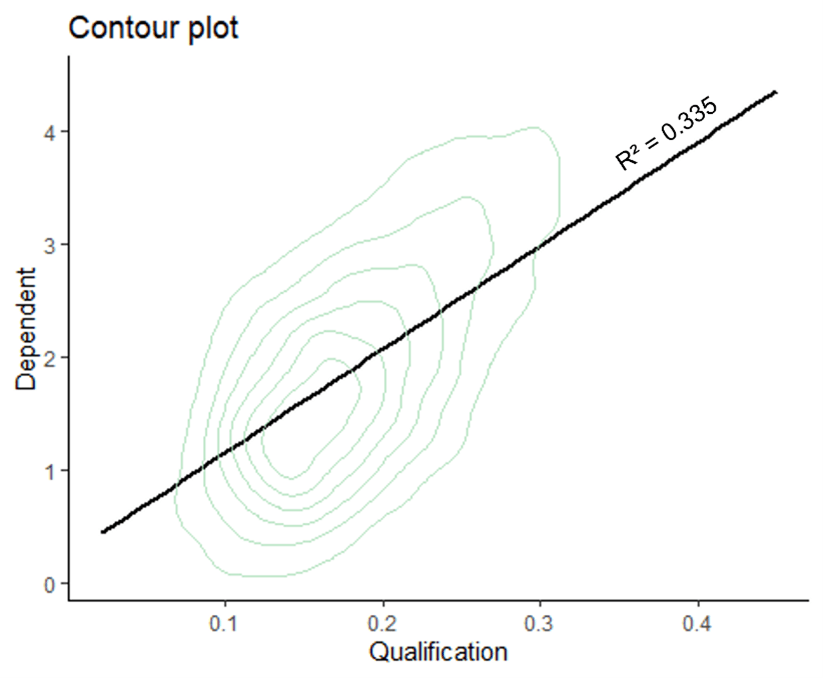
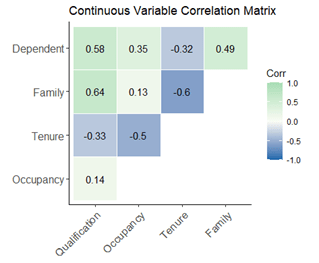
R Studio was used to handle the database of incidents and ggplot2 was used to generate visual analysis to support the linear regression using independent variables.
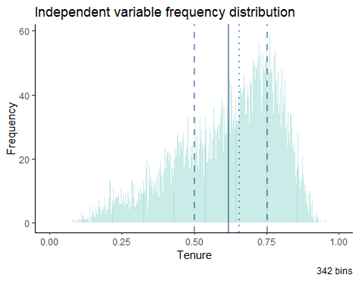
Model outputs were analysed for autocorrelation, and residual errors checked again using ggplot 2
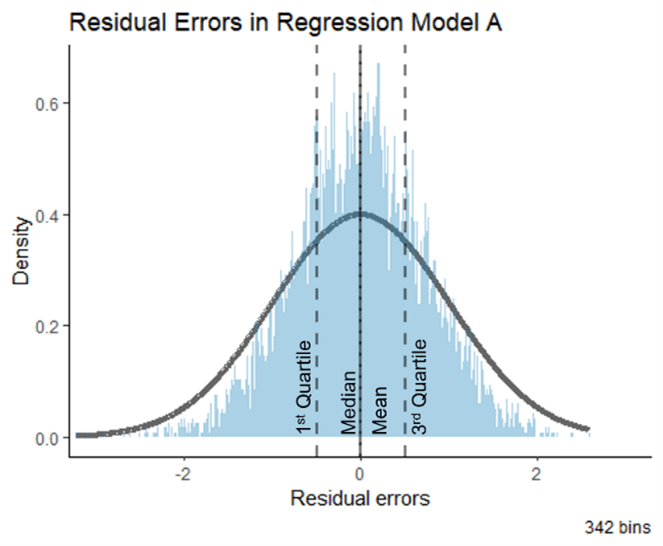

The model outputs were used to show that there were statistically significant distributions of deliberate and malicious fire and non-fire incidents including hoax calls by Fire and Rescue Authority. Two models were presented that looked exclusively at Fire and Rescue Authority boundaries and one that also considered the selected continuous variables.