This project, inspired by Manchester City of Trees considered the lesser spotted woodpecker as an indicator species to help assess the functional and structural connectivity of green and blue infrastructure in Wythenshawe, Manchester. The bird has very specific nesting requirements and the habitats were considered as a connected network. Without detailed tracks of actual bird flights in the area, connectivity was assessed based on assessed access to their food such as caterpillars and invertebrates that live in deadwood.
“
this report stands out due to its
well-structured presentation,
high quality figures
and thorough understanding
…
the analysis on the modified
index of connectivity excels
”
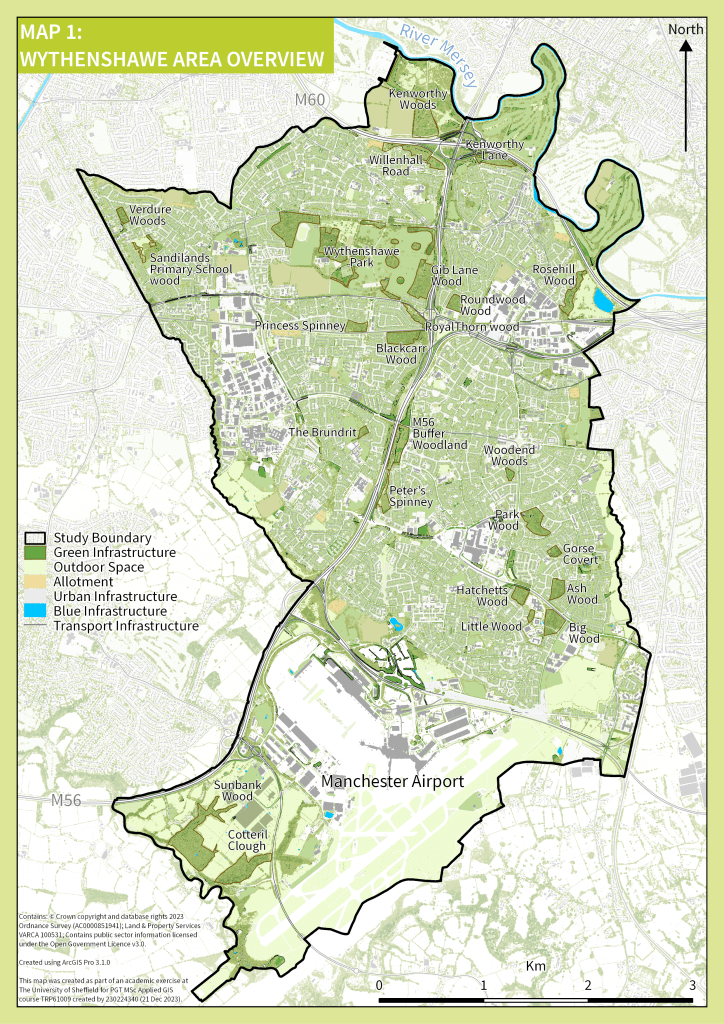
Map 1 was part of the introduction and established the consistent style used throughout. This style was reflected in the visual design of the rest of the report. This helped not only introduce the study area, but also create a visually continuity and appeal. The semi-transparent external areas helped to establish significant green and blue infrastructure outside the study area for recommendations but sufficiently close to consider for connectivity between nesting and feeding habitats.
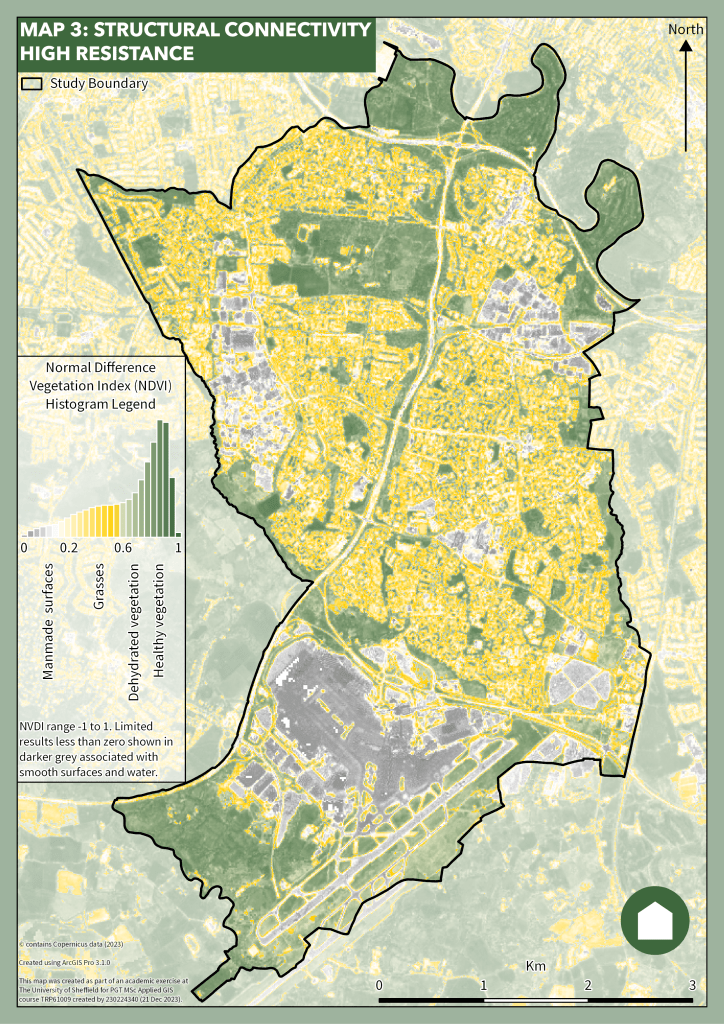
A framework of factors were used to assess the structural connectivity for the birds. Map 3 High Resistance, was part of the input data used to assess the structural connectivity. Using a Normalised Difference Vegetation Index, large industrial area devoid of street planting common in Wythenshawe were identified and considered against behavioural characteristics for the species. A histo-legend helped to establish additional properties for the study area.
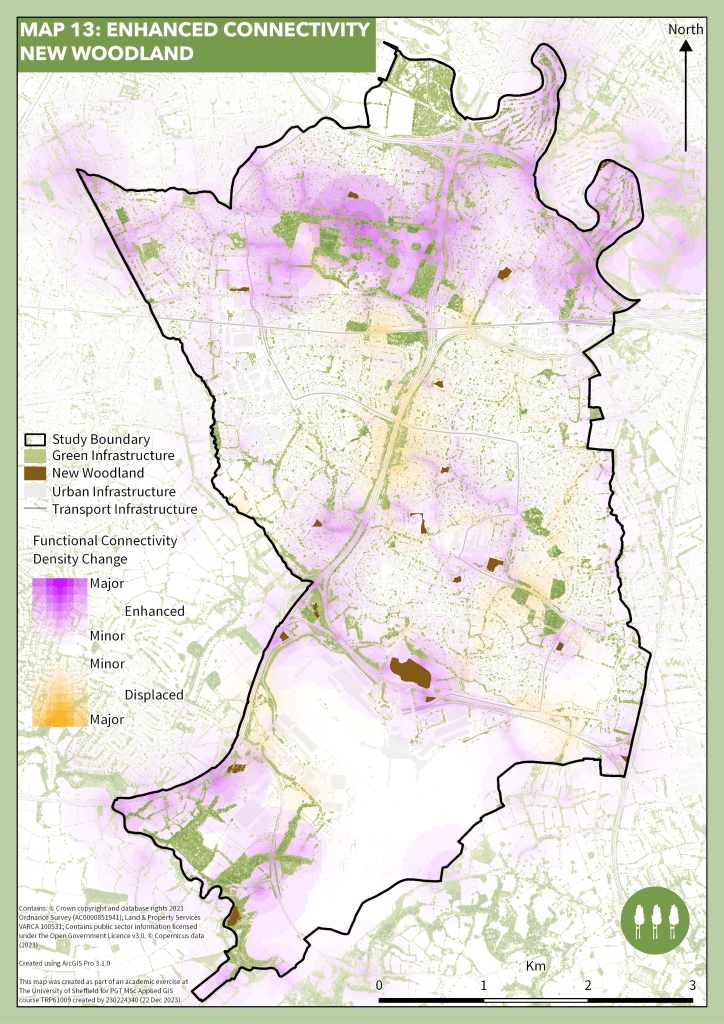
A framework of six factors were used as input data to assess the structural connectivity. The associated cost matrix was then used to assess interior habitats and the functional connectivity between viable nesting and feeding sites. ArcGIS Pro model builder was used to create a repeatable framework for the connectivity calculations an enable an assessment to be made on the impact of specific types of additional planting.

ArcGIS Pro Model builder has been used extensively.
Map 13 showed one example of a new planting plan and the assessed impact on functional connectivity density change. Five intervention plans were modelled with similar maps using a consistent analytical methodology and quantified using a modified index of connectivity to help quantify the overall enhancement and displacement of functional connectivity for the indicator species.