How can semiology and visual efficiency be applied to true 3D printed special constructions?
Using a mixed methods approach, I used an interpretivist methodology to examine existing 3D printable maps using the 3D printing communities social media sites.
- 2,275 maps collected and assessed
- Fifteen examples presented
- Attribute space 𝒜1 – 𝒜4
- Reference space – mixed 2D and 3D
- 15 visual variables
- 5 levels of perception
The summary identified the most efficient visual form compatible with the printing technology and argued that cartography is largely about how you design maps based on what you can make the printing equipment do.
The second method used action research and presented a refined GIS workflow developed from the systematic improvement process. Early prototypes were encoded using QGIS Dem to 3D similar to Justin Cole’s (2024) map but the final workflow presented encoded features as multipatch feature classes and converted them to CAD files using ESRI tools.
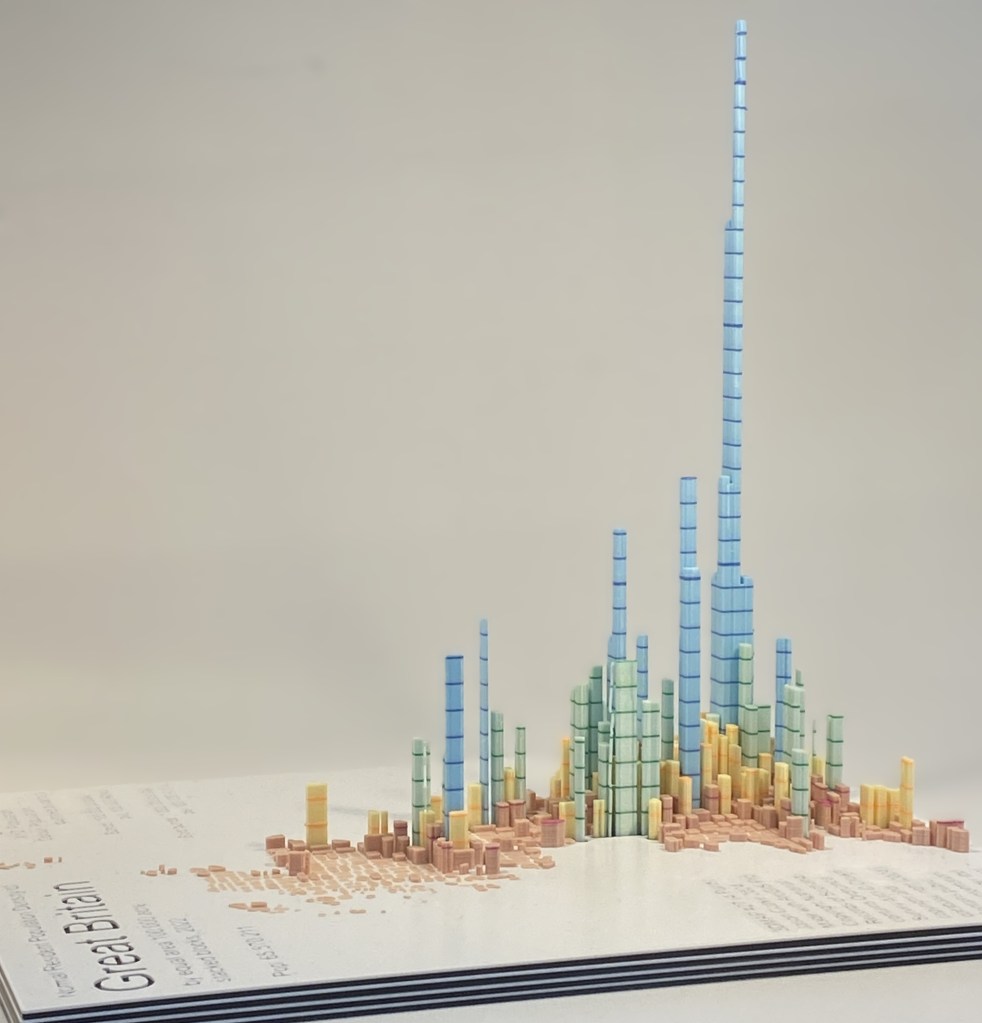
Annex A: Model profile including downloadable printable files.
- 40 hours 40 minutes printing
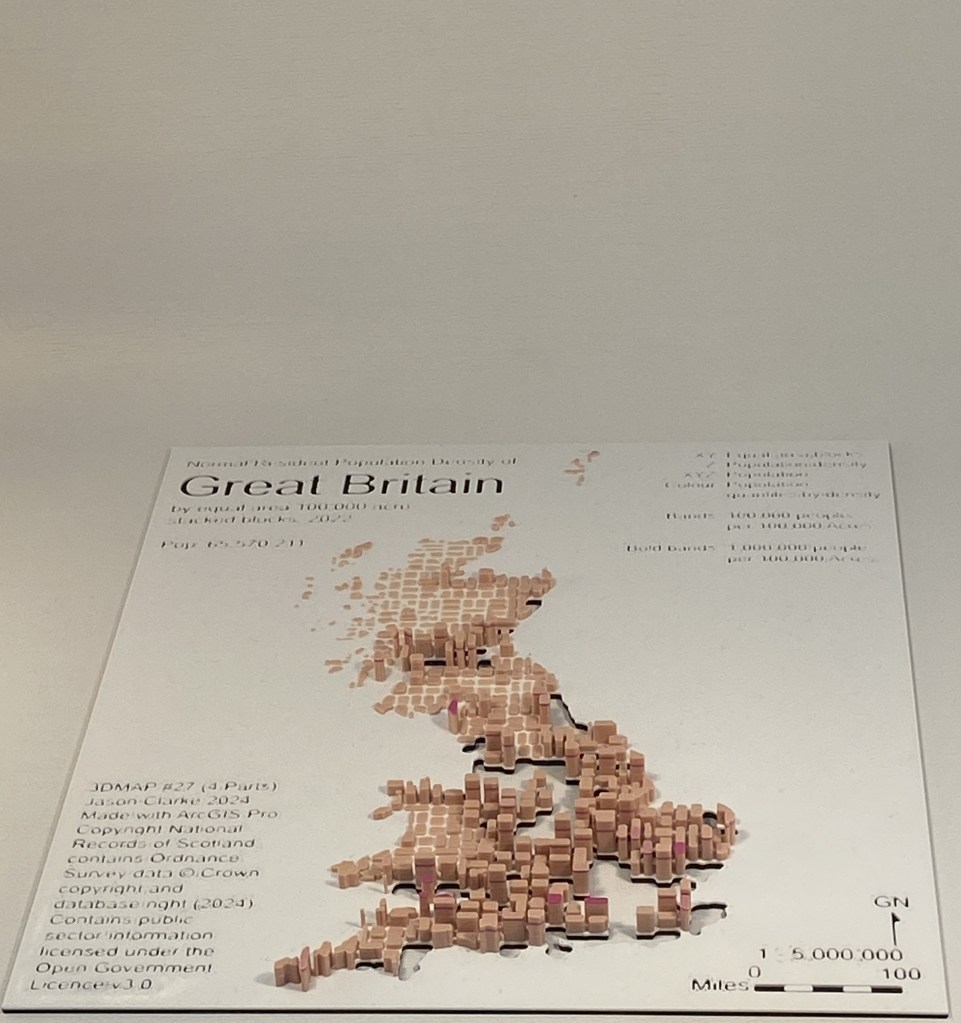
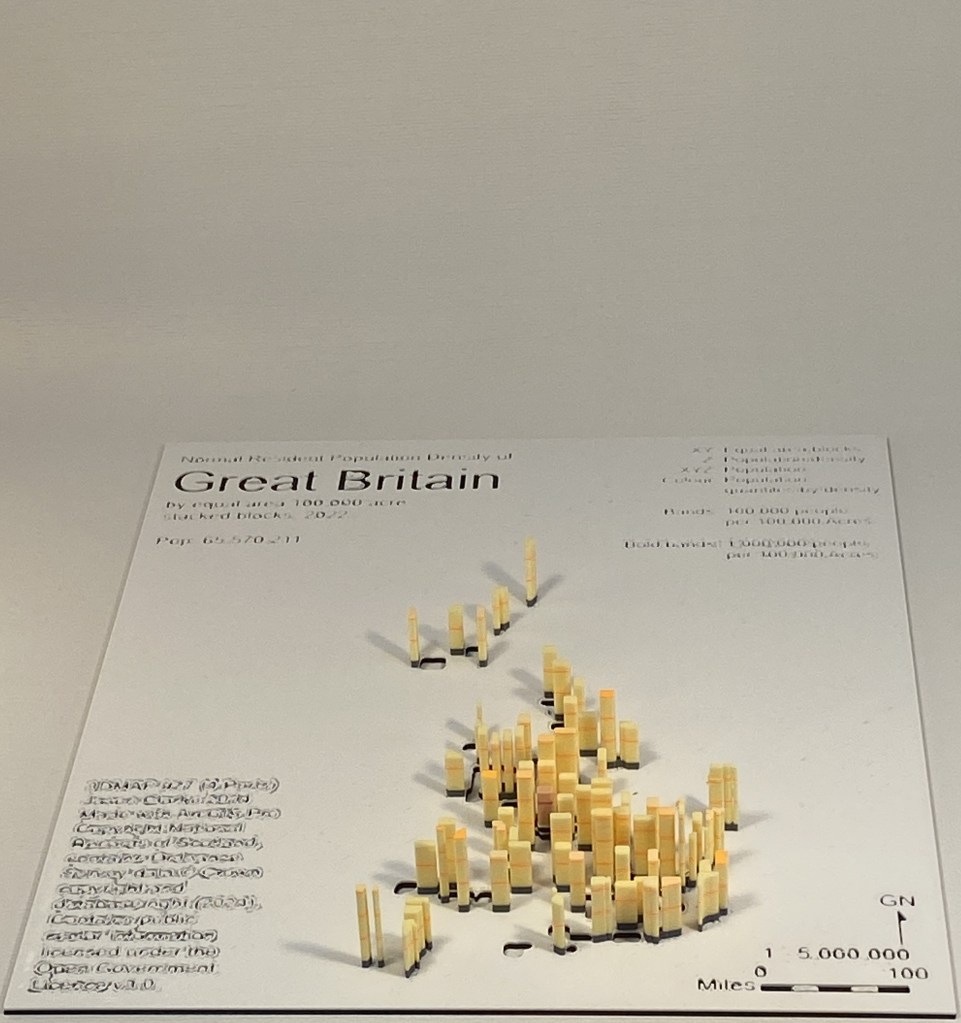
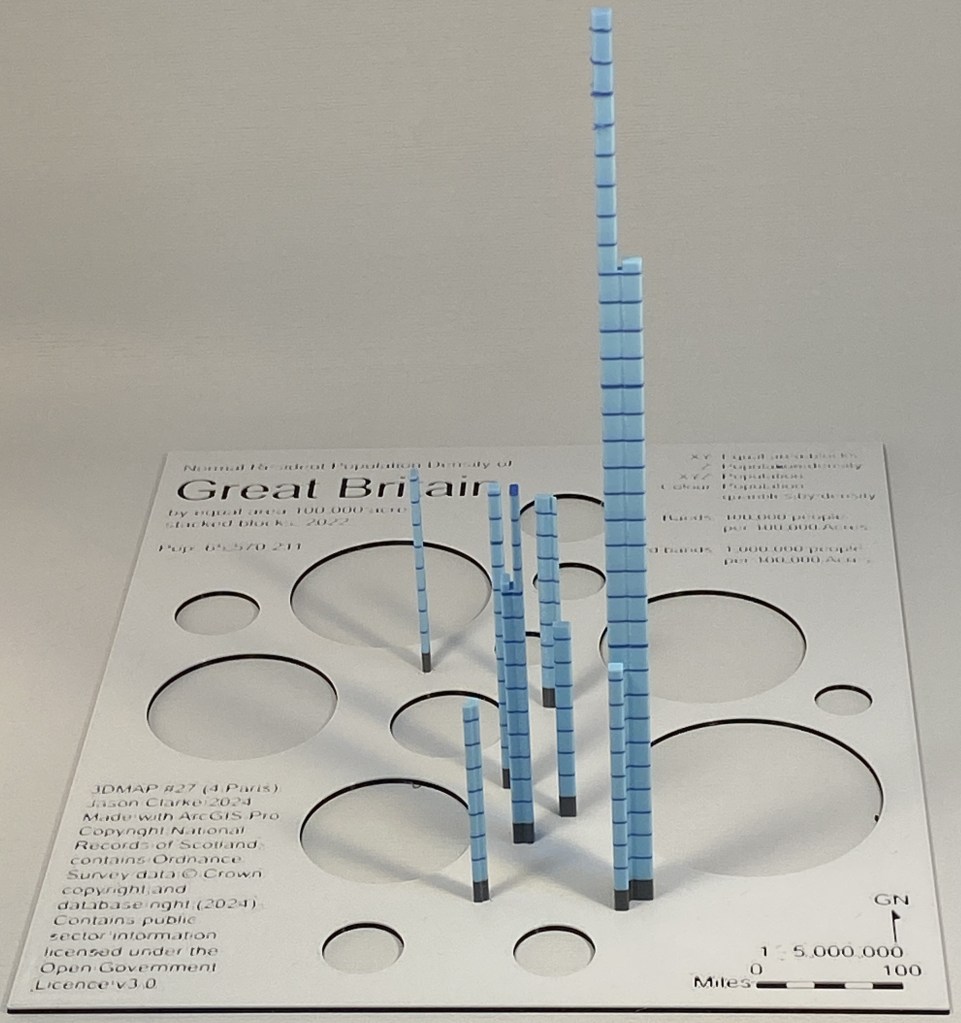
- 4 x parts
- 96 mid print filament changes
- 11 colours
- 0.2 mm layers
- 0.4 mm hot nozzle
- 516g Polylactic acid

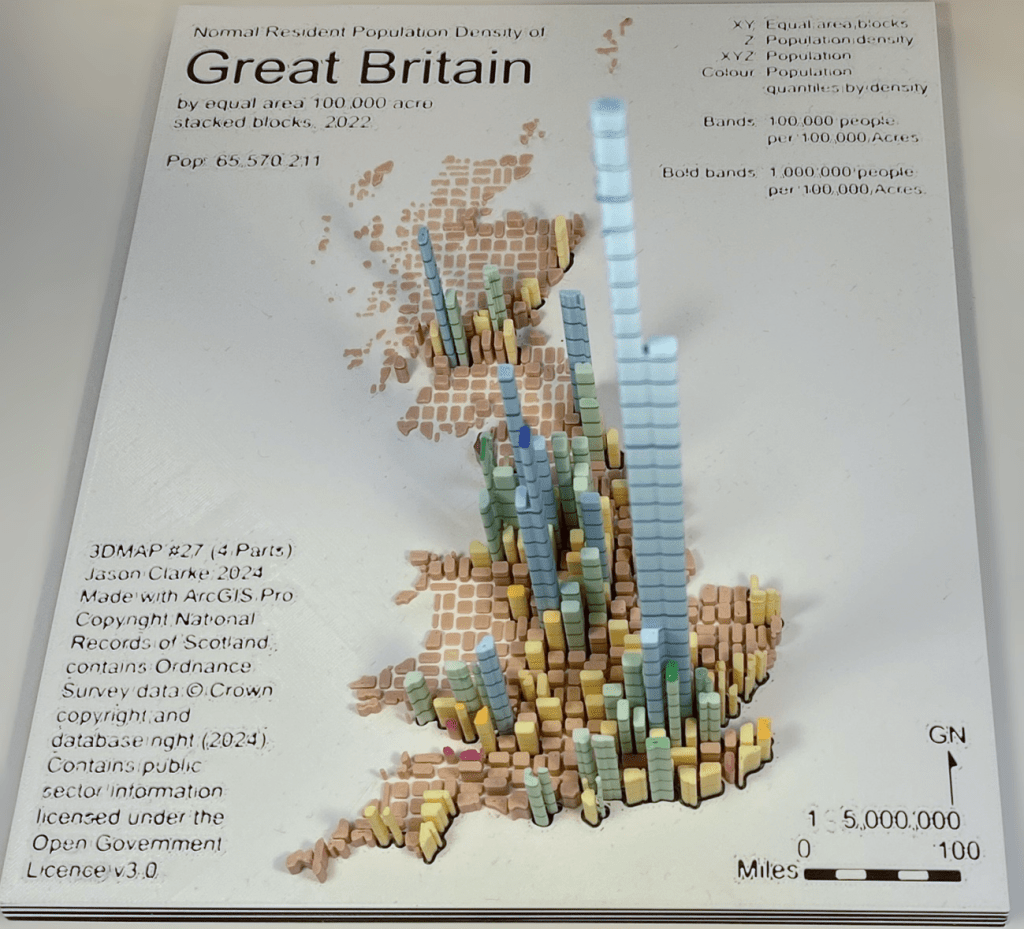
The final result was a visually efficient example with a four dimensional attribute space, showing population density, absolute population, population quartiles by density using dark bands to establish a common scale which could be quickly perceived and measurements accurately measured.
Abstract: True 3D printed maps are hardcopy physical models that can implant three-dimensional marks or extrude two-dimensional marks to employ height as a visual variable in combination with traditional cartographic options. This dissertation used a mixed methods approach to combine the hermeneutic interpretation of a collection of 3D printed maps and work-based action research to develop both a workflow and semiologically efficient novel example. Four 3D printing social media websites were searched for examples of maps; then classified according to their attribute and reference space and use of visual variables. The collection was curated and analysed to explain the application of different semiological visualisation techniques and help frame the opportunities afforded by the existing technology. The dissertation presents both an innovative process for converting three-dimensional features to printable stl files using ESRI tools and the successful application to 2022 British Population Density. The 3D printed special construction incorporated a true 3D prism map in four coloured interlocking independent structures; printed in 40 hours and 42 minutes incorporating 96 mid print filament changes and 11 coloured filaments. Scheduled filament changes established associative perception of texture representing a common scale; and the overall map represented a visually efficient example with a four-dimensional attribute space.
